
18 Jan Twin Cities Midwifery’s Cesarean Rate and other Statistics through December 2016
by Kate Saumweber Hogan, CPM, LM
When I meet with families who are looking to choose a midwife, I am often asked about the statistics available for my home birth practice. While I do gather data, the small size of my practice brings the usefulness of these particular rates into question. With such a small pool of data, how statistically significant would these numbers be? Thus, I often direct families to studies that look at a much larger pool of data than mine.
Home birth studies shed light on safety and other key indicators
A number of studies demonstrate the safety of planned home birth for healthy, low-risk pregnancies with a trained attendant, such as this one from Canada, this one from the Netherlands, this one from England, and this one from New Zealand. An article by Johnson and Daviss, “Outcomes of planned home births with certified professional midwives: large prospective study in North America,” is especially important in that it uses data from planned home births in the U.S., and it not only addresses safety but also looks at hospital transport rates, cesarean rates, and other statistics that families commonly ask about. In 2014, Cheyney released a study looking at outcomes of almost 17,000 planned home births in the United states. This study is a great reference for similar outcomes that I track in my practice, such as transfer rates, vaginal birth, assisted delivery, and cesarean birth rates for families planning a home birth.
Birth statistics are becoming more freely available
Over the past few years, I have noticed that hospitals and clinics are becoming more transparent in the care they provide. There is still a long road ahead of them, but due to the demand from informed consumers (pregnant people and families!), data on interventions like cesarean sections is becoming easier and easier to find. Annually, a report comes to my email discussing the cesarean rates by Minnesota hospital and Wisconsin hospital, and this report details rates by clinic (starting on page 175). I think it is fantastic that families have this information accessible to them as they choose a provider and consider who will walk with them on their journey of pregnancy, birth, and postpartum care.
I’m also inspired by our very own, local Childbirth Collective, which requires members to participate in a data-gathering project to learn more about the births its doula members attend. I always look forward to seeing what is included in their data report!
Statistics are a mirror that help us see and improve practice
I have been amazed by how Twin Cities Midwifery has grown and flourished over the past six years. I still limit my practice to about 3-5 due dates a month, and there are certain months when I plan ahead, not taking any due dates, allowing for a planned vacation, or a birth in my own family. This means that the pool of data is still small, but I need to start somewhere. I intend to update my statistics annually to provide a level of transparency to families wanting to learn more about my practice.
I know that the numbers will ebb and flow. I think that the Johnson and Daviss article gives good estimates of where my statistics will eventually hover around. For example, when they looked at all home births attended by certified professional midwives in the U.S. and Canada in 2000, they found:
- 12.1% of clients who intended to deliver at home when labor began were transferred to hospital during labor or postpartum. People giving birth for the first time had a 25.1% transfer rate and those having a second or subsequent baby had a 6.3% transfer rate.
Medical intervention rates included:
- Epidural: 4.7%
- Forceps: 1.0%
- Vacuum extraction: 0.6%
- Caesarean section: 3.7%
Another great place to look for statistics is Cheyney’s article, Outcomes of Care for 16,924 Planned Home Births in the United States: The Midwives Alliance of North America Statistics Project, 2004 to 2009. Her study found that of the 16,924 pregnant people who planned homebirths at the onset of labor:
- 89.1% gave birth at home, meaning 10.9% were transferred to hospital during labor. Of people giving birth for the first time, 22.9% transfered during labor, while only 7.5% of non-first time parents transfered.
- There was a postpartum transfer rate of 1.5%
- There was a newborn transfer rate of 0.9%
- 93.6% gave birth vaginally
Medical intervention rates included:
- Epidural and/or oxytocin augmentation: 4.5%
- Assisted vaginal birth (forceps or vacuum extraction): 1.2%
- Caesarean birth: 5.2%
All obstetrical interventions have a place, and I’m glad that I practice in an area where we have access to wonderful hospital care when it is needed. Being able to transport when we need to and receiving appropriate care in the hospital is what makes planning a home birth so safe; when we need extra help, we get it.
The problem we have in our country is not that people have cesareans or other interventions, but that so many have unnecessary cesareans or unnecessary interventions (which in turn carry risks and cause additional health problems for birthing people and babies). Just like all obstetrical interventions, when overused, they can cause more harm than good. The Childbirth Connection has a useful article about why our national cesarean rate of 32.2% is so high. According to the article, the optimal cesarean rate is 4-6% for a low-risk population. Since home birth midwives work with an exceptionally healthy and low-risk population, it would make sense for the rate in this population to close to that range. The Johnson and Daviss study found a 3.7% cesarean rate. The Cheyney study found a 5.7% cesarean rate.
So what are Twin Cities Midwifery’s stats over the past five years?
These statistics below encompass all 175 pregnancies which care was established for, starting from when I opened Twin Cities Midwifery in December of 2010 with due dates or pregnancy end dates through December of 2016. In this six year period, 38.9% (68) were first-time pregnancies, and 61.1% (107) were a subsequent pregnancy. Unfortunately, 9.1% (16) of the pregnancies ended in miscarriage. Another 14.9% (26) transferred out of my care during their pregnancy; 7.4% (13) were for non medical reasons (such as moving out of my service area, or changing their mind on place of birth or provider), and 7.4% (13) were transferred during pregnancy for medical reasons (such as preterm labor, preterm rupture of membranes, high blood pressure, or cholestasis). I joined all 13 of the clients who transfered prenatally for medical indications at their hospital births, providing non-medical support (such as doula support), and accepted them all back into my care for postpartum and newborn care after hospital discharge. Out of all 175 pregnancies under the care of TCM, 7.4% (13) transferred to the hospital during labor.
Stats for full term pregnancies, starting labor as a planned home birth
Of the 133 pregnant people who were under my care when their labor started, 36.1% (48) were first time parents, and 63.9% (85) were experiencing their second, third, fourth, or sixth babies.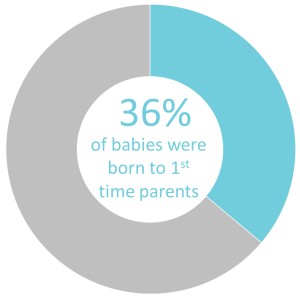
The majority of those families, 87.2% (116), chose to have a water birth tub available to them in labor. Of those who had water immersion available, 91.4% (106) labored in water, and 58.6% (68) gave birth in water, which is 51.1% (68) of the total births. Not all of the clients who had water available planned or wanted to birth in the water. There were 10 clients who planned to labor in the water but did not. They were not able to utilize the tub in labor either because their labor was so fast that there was no time to set up the tub, once the tub was set up they were already pushing and did not want to move to get in the water, or because they transferred to the hospital prior to active labor.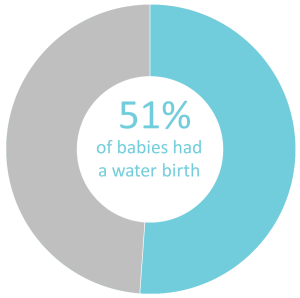
Of the babies I helped to welcome in the world, 49.6% (66) were girls, and 50.4% (67) were boys. The smallest baby was 5 pounds 14 ounces, the heaviest was 11 pounds 5 ounces, and the average was 7 pounds 15.5 ounces.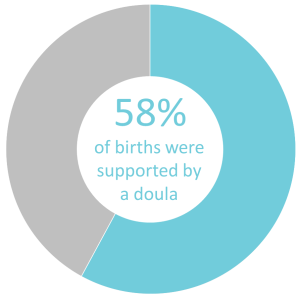
A doula was present at 57.9% (77) of these labors; 62.5% (30) of first-time parents had a doula, while 55.3% (47) of parents of two or more had a doula with them.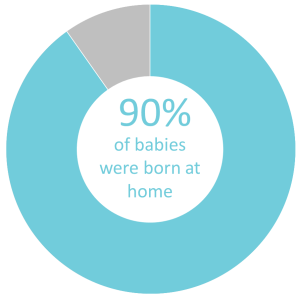 Of these 133 clients who intended to deliver at home when labor began, 90.2% (120) gave birth at home, meaning that we transferred 9.8% (13) of these labors to the hospital. All of the hospital transfers during labor were non-urgent, 10 were first time labors, and 2 were VBAC labors; one transfer was due to signs of infection during labor, one due to thick meconium stained amniotic fluid, one due to abnormal heart tones with history of previous cesarean, and the others were due to very long labors with a labor progression that slowed or had stopped.
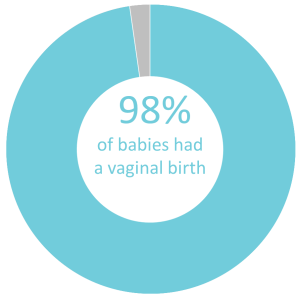 Due to transfers to the hospital during labor, Twin Cities Midwifery has an epidural rate of 6.8% (9) and a pitocin augmentation rate of 7.5% (10). All but three clients who transferred gave birth vaginally (2 primary cesareans, 1 repeat cesarean); 0.8% (1) were assisted by vacuum, and 0.8% (1) were assisted by forceps. Twin Cities Midwifery’s cesarean rate is 2.3% (3).
We have had a 3% (4) postpartum transfer rate (one retained placenta, three for significant laceration repair) and a 3% (4) newborn transfer rate (all for signs of respiratory distress). Of the total 47 transfers (prenatally, during labor, postpartum, and newborn), only 6.4% (3) were considered urgent. Most transfers, 93.6% (44) were not urgent.
I’ve also tracked rates of intact perineums and perineal tears. I have recently heard people say things such as “all first time moms tear,” “most people need stitches after giving birth,” or “it just doesn’t matter what we do, you will tear.” I’ve been shocked when I hear these statements, because they don’t resonate as true in my experience.
Over the past six years, 72.2% (96) of clients who started labor under my care had no or minimal tearing (37.6% (50) had an intact perineum, 7.5% (10) had minor skids, 27.1% (36) had a 1st degree tear). There were 25.6% (34) clients who experienced a 2nd degree tear, 2.3% (3) who had a 3rd degree tear, no 4th degree tears, and 0.8% (1) who required an episiotomy. Not all tears require suturing, therefore only 24.8% (33) of those who started labor in my care needed sutures to repair their tear.
I also separated this data by clients giving birth for the first time and non-first time parents. I found that in my practice, it is true that when giving birth for the first time, a tear is more likely, however I would not agree that most first time moms tear. Of the 48 clients giving birth for the first time who started labor under my care, less than half, 41.7% (20) required a repair. There were 20.8% (10) of first time clients who had a perfectly intact perineum, 31.3% (15) who had a skid or 1st degree tear, and 47.9% (23) who had a 2nd or 3rd degree tear. Looking at perineal outcomes for the 85 multiparous clients (people who have previously given birth), only 15.3% (13) required a repair. There were 47.1% (40) who had an intact perineum, 36.5% (31) who had a skid or 1st degree tear, and only 16.5% (14) who experienced a 2nd or 3rd degree tear.
In 2015, we also started tracking insurance reimbursement rates. State funded Medical Assistance (MA) or MN Care plans do not cover services provided by Twin Cities Midwifery, however, private insurance plans often do cover our midwifery care. Out of all of our clients who birthed in 2015-2016 with private insurance, 31% had 100% coverage after meeting their deductible. Since deductible levels varied, we also looked at specific dollar amounts families were reimbursed. Of those who birthed in 2015-2016 with private insurance, over 70% were reimbursed at least $1,000, 42% were reimbursed over $2,000, and almost 40% received more than $3000 back from their insurance plan to pay for their care. For more information on insurance coverage of home birth services, check out our Insurance Benefits blog post.
Toward healthier, safer births for pregnant people and babies in Minnesota
I am honored to have attended each and every one of these births and am so grateful for the opportunity to be with families during this incredibly special time. I look forward to our regular TCM events so that I get to watch these babies grow! With this midwifery model of care, Twin Cities Midwifery is helping to improve our state’s maternal and newborn outcomes in a healthy and safe way, one birth at a time.
A huge shout out and thank you to Brandi Olson of Brandi Olson Consulting for dreaming up and creating these gorgeous infographics! Brandi builds the capacity of mission-driven business to deepen their impact through agile strategic planning, evaluation, and data storytelling.




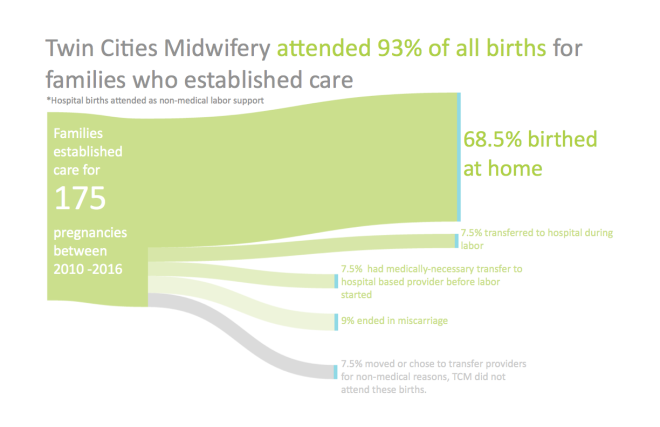

Highlights of Twin Cities Midwifery’s Stats through 2016 – Twin Cities Midwifery Blog
Posted at 11:29h, 18 January[…] Here you’ll find a quick snapshot of TCM’s statistics, but I’d recommend heading over to the full stats posts to get the details! […]