18 Jan Highlights of Twin Cities Midwifery’s Stats through 2016
by Kate Saumweber Hogan, CPM, LM
Here you’ll find a quick snapshot of TCM’s statistics, but I’d recommend heading over to the full stats posts to get the details!
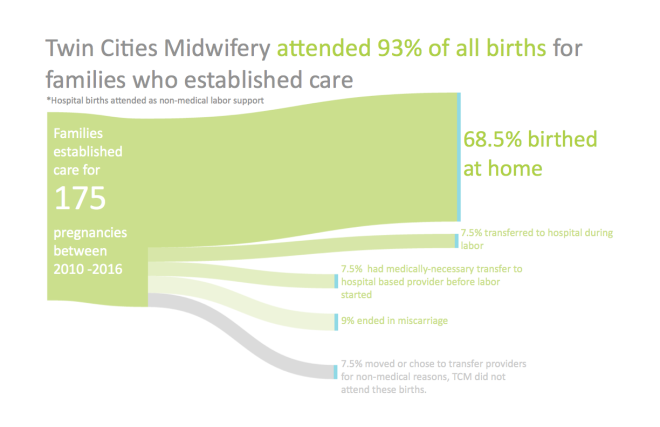
This first image shows what the journey looks like from establishing care to birth. You’ll see that most of our client’s births happen at home, as planned. However, some pregnancies end in miscarriage, and sometimes there are medical or non-medical reasons to transfer care during pregnancy.
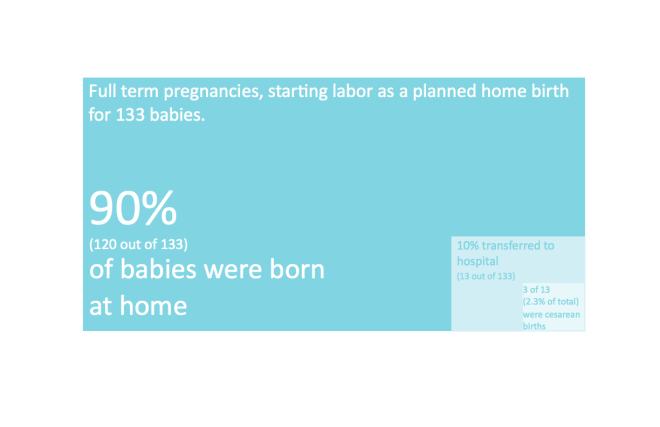
The second image looks at labor itself. For all of our clients who started labor intending to birth at home, 90.2% welcomed their babies at home, as expected. We transferred to the hospital 9.8% of the time, which resulted in only a 2.3% cesarean rate.
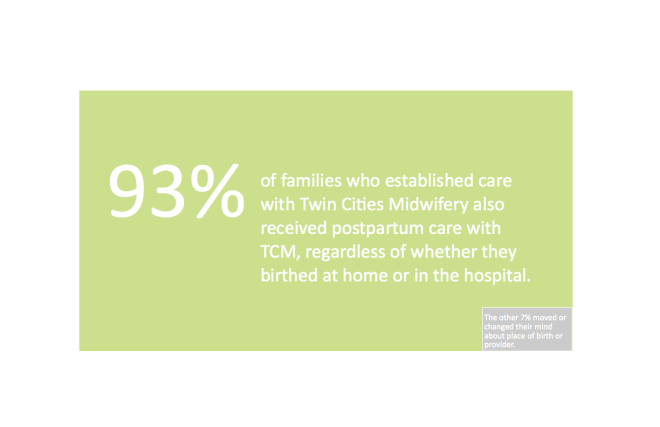
This third image represents all of the pregnancies which care was established for, and looks to the end of their journey, their postpartum and newborn care. It shows that regardless of where a TCM family ends up giving birth, they are still a TCM family, they still have TCM support during labor (non-medical support if the birth occurs in the hosptial), and are welcomed back into the practice for postpartum and newborn follow up care. Choosing a homebirth midwifery practice committed to continuity of care is one of the only ways that you can have your care provider walk with you through the full journey of pregnancy, birth, and parenthood.
I so enjoy getting to be there every step of the way with each one of these families. Be sure to head over to the full 2016 stats blog post to get to learn more about TCM journeys.
A huge shout out and thank you to Brandi Olson of Brandi Olson Consulting for dreaming up and creating these gorgeous infographics! Brandi builds the capacity of mission-driven business to deepen their impact through agile strategic planning, evaluation, and data storytelling.


Sorry, the comment form is closed at this time.